What you'll be able to do
- Decide whether a modifiability mechanism pays for itself, using the SEI cost-of-modifiability inequality.
- Choose availability and modifiability tactics from the SEI catalogues and tie each to a concrete component.
- Compose availability across series and redundant components, and name the assumptions that make the result optimistic.
- Turn an availability target into an SLO with a window and an error budget, and set an RTO and RPO that select a disaster-recovery strategy.
- Pick the performance test that answers a given question, and the scale-cube axis that fits a given bottleneck.
- Run a STRIDE pass and check security tactics for coverage across detect, resist, react and recover.
- Instrument a design for observability — signals, golden signals, trace context, burn-rate alerts — without putting patient data into telemetry.
- Express run cost as a unit cost, find the line that dominates it, and choose the cost tactics that actually move it.
This unit is the reference half of Module 3: deep dives into the quality attributes that drive most designs — modifiability, performance, scalability, reliability and availability, security, observability and cost-efficiency — with the SEI tactic catalogues where SEI has one; scalability uses Abbott and Fisher's rules, and observability and cost-efficiency use practitioner catalogues — and a look at how one style, SOA, shifts them. Part 1 teaches the method: ASRs, scenarios, the utility tree and deriving numbers from the business. Read part 1 first, come here when you choose tactics for your top three attributes, and return from Modules 4 and 9 when a design decision needs the detail. There is no separate Task: this part is the reference for the Module 3 Task.
Maintainability / Modifiability in depth
Maintainability is one of the key quality attributes present in almost any categorisation from any source. SEI's closest equivalent is Modifiability. In ISO/IEC 25010, Modifiability is one sub-characteristic of Maintainability, alongside modularity, reusability, analysability and testability — so Maintainability is the broader term, though both centre on the ease of applying a change to a product or system.
In practice we frequently deal not with building solutions from the ground up but with adding features to existing solutions, re-platforming, updating technology stacks and similar. Code is read far more frequently than it is written.
It is usually said that only one requirement is always stable — the inevitability of change.
Changes arise constantly: requirements change frequently even before the system reaches its intended users, and as the system is used the need for additional features arises and bugs are revealed. Most of the cost of a typical software system occurs after it has been initially released.
The cost of modifiability. Bass, Clements and Kazman (Software Architecture in Practice) reduce the decision to an inequality. Suppose you expect N changes of one kind over the system's life, and you could build a mechanism that makes them cheap — a configuration table, a rules engine, a plug-in interface. Compare:
N × cost(change without mechanism) ≤ cost(mechanism) + N × cost(change with mechanism)
While the inequality holds, changing the code by hand each time is cheaper and the mechanism is gold-plating. Once N passes the break-even point — cost(mechanism) ÷ (cost without − cost with) — it flips, and the mechanism pays.
On Lumen, QA10 commits to such a mechanism for clinical-protocol and policy changes, and F04 and F08 to one for the workflow stages and prioritisation rules. Assume a change made in code costs about $4,000 (development, regression test and a release), the same change through configuration about $400, and the configurable rules-and-workflow mechanism $120,000 to build. Break-even is 120,000 ÷ (4,000 − 400) ≈ 33 changes; at an assumed two such changes a month, it is reached in about 17 months, well inside the five-year total cost Lumen evaluates bids on. If discovery found that Lumen changes its protocols twice a year, the same arithmetic would argue QA10 down.
Three ramifications follow:
- The cost of making a system more modifiable may vary substantially — from development cost where a developer applies changes through code, to visual configuration where end-users apply changes and see results immediately (CMS systems)
- The cost of making a system adaptable to changes should imply the potential costs of applying those changes
- As systems evolve, other configuration mechanisms get added — the later you add those mechanisms, the higher the cost. That is why F04's stage list is externalised before go-live rather than retrofitted
Binding is the concept SEI uses heavily to elaborate on architecture flexibility. Binding time decisions heavily influence maintainability: the more choices to bind a value to a specific parameter exist, the more flexible the system. The value can be anything depending on scale — from reading a single value from configuration, to replacing a component during runtime via DI or service location. Late binding is usually considered more flexible than early binding, but that comes at the cost of implementing specific infrastructure for late binding.
Tools do not usually provide much help in increasing architecture maintainability. Static code analyzers such as NDepend help get an initial feeling for a system's complexity, but when it comes to real re-factoring or re-architecting such tools rarely provide thorough guidance. What does help: unified coding standards verified by linters; conducting architecture and code reviews; keeping an up-to-date backlog of technical, design and architecture debt.
Do not underestimate the value of conformity of architecture and code — practice tells that the maintainability of a solution where the same approaches are used everywhere is dramatically higher.
Note cohesion and coupling — very ubiquitous principles applicable at almost all levels.
Modifiability tactics
The SEI catalogue (Bass, Clements & Kazman, Software Architecture in Practice, 3rd ed.; the 4th edition regroups a few) sorts modifiability tactics by what they do to the modules a change touches:
| Group | Tactics | On Lumen |
|---|---|---|
| Reduce the size of a module | Split module | Split prioritisation-rule evaluation out of the booking workflow service, so a rule change (F08) does not touch booking code |
| Increase cohesion | Increase semantic coherence — keep responsibilities that change for the same reason in one module | Keep everything about partner availability — manual uploads and the automated partner adapter — behind one partner-availability module (F03) |
| Reduce coupling | Encapsulate; use an intermediary; restrict dependencies; refactor; abstract common services | Put an adapter between the referral system's extract and the platform that translates it into the platform's own model, so a referral-system change touches one module (F07, QA11) |
| Defer binding | Bind at build, deployment, start-up or run time: parameters, configuration files, plug-ins, runtime registration, interpreted rules | Hold workflow stages and prioritisation rules as versioned configuration interpreted at run time (F04, F08, QA10) |
Deferring binding is the most powerful group and the most expensive, because late binding needs infrastructure of its own. It is where the inequality above earns its keep.
Performance in depth
Performance is the quality attribute articulated explicitly in almost all requirements documents. If it is not articulated, the rule of thumb is to ask about it. If it is considered that there are no specific performance requirements, there still are some — always double-check with the client what their performance expectations are, because sometimes you will be surprised. The best method to check whether performance complies with expectations and the SLA is performance testing.
Key characteristics: bandwidth, latency, response time, throughput — usually articulated in the measure part of a scenario. Less common: the jitter of the response (allowable variation in latency), and the number of events not processed because the system was too busy to respond.
SEI gives two general tactic groups to achieve performance requirements: control resource demand and manage resources. The most ubiquitous tactics: Prioritize Events, Reduce Overhead, Increase Resource Efficiency, Increase Resources, Introduce Concurrency, Maintain Multiple Copies of Computations, Maintain Multiple Copies of Data, Schedule Resources. Some are highly specific — Manage Sampling Rate applies only to streaming data processing — while others such as Increase Resource Efficiency are generic.
Types of performance testing
| Type | Purpose |
|---|---|
| Load testing | Understand the behaviour of the system under a specific expected load — the expected concurrent number of users performing a specific number of transactions within a set duration |
| Stress testing | Understand the upper limits of capacity within the system |
| Soak testing (endurance) | Determine whether the system can sustain the continuous expected load |
| Spike testing | Suddenly increase or decrease the load generated by a very large number of users and observe behaviour. Determine whether performance will suffer, the system will fail, or it will handle dramatic changes |
Others exist — configuration testing, isolation testing. It is not required to remember every type, but it is important to understand the approaches and tools that measure performance in different circumstances.
A very good piece of advice: analyse performance on production data and in production environments. A very common mistake is evaluating system performance against data that is not similar to production data. Keep the performance testing environment very close to production, otherwise you run a high risk that results will not reflect the real state of things.
Analyse the error log and any other tracing captured during a test. When there is an error, take a memory dump and analyse it. Performance optimization is hard — always measure and use profilers such as Dynatrace or dotTrace.
The profiler story (Ron Jeffries' sidebar in Fowler's Refactoring, 1999): the tests for the Chrysler Comprehensive Compensation payroll system were running too slowly, and Kent Beck, Martin Fowler and Jeffries set out to fix them. Beforehand, Jeffries speculated from his detailed knowledge of the system about what was slowing it down, and discussed likely fixes with colleagues. When they measured with a profiler, none of those ideas turned out to be the problem: the system was spending about half its time creating date objects, built through string conversion purely for convenience. The real bottleneck was not on anyone's list. Lesson: when it comes to performance, always measure, don't guess.
Be careful analysing stakeholders' requirements: performance is usually a requirement even when not mentioned explicitly — however, high performance is usually very expensive to achieve.
Scalability
There are many definitions, and they all revolve around the system's ability to handle increased load while maintaining the expected SLA. Scalability might be considered a kind of Modifiability/Maintainability, but it became so popular with the advent of cloud computing and microservices that it is usually treated as a standalone quality attribute.
Two basic kinds: vertical (scaling up) and horizontal (scaling out). Horizontal scaling always means more than one node, so even a cloned monolith needs load balancing and state held outside the process; vertical scaling needs neither.
The scale cube
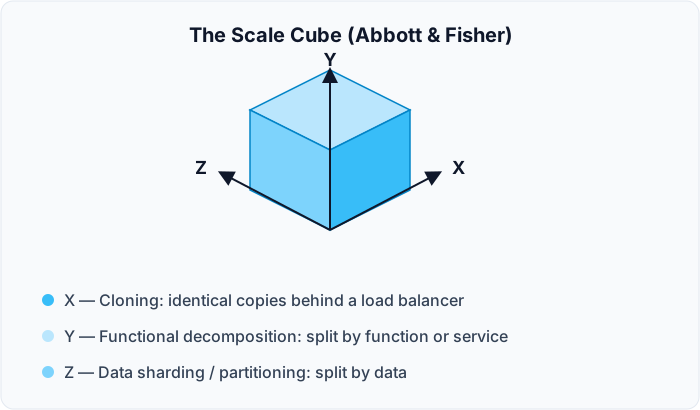
The scale cube comes from Abbott and Fisher, The Art of Scalability; Chris Richardson's microservices.io popularised it for microservices.
| Axis | Meaning | Applicability |
|---|---|---|
| X axis | Cloning — identical copies behind a load balancer | The simplest axis, and it applies to a monolith as well as to distributed systems. Needs stateless components, or state held outside the clones |
| Y axis | Functional decomposition — split by function or service | Splitting into separately deployed services is what makes a system distributed. Inside a monolith the same split gives modularity, but no independent scaling |
| Z axis | Data partitioning (sharding) — each copy serves a subset, for example by customer or geography | Applies to the application tier as well as the data tier. Not every system can benefit — sharding/partitioning is a challenging concept for many databases |
Selected scalability rules (Abbott & Fisher, Scalability Rules)
Mostly applicable to web information systems. Rule numbers follow Abbott and Fisher's Scalability Rules: 50 Principles for Scaling Web Sites; the summaries below paraphrase the book — read the original for the full argument.
| Rule | Content |
|---|---|
| 19 | Relax Temporal Constraints. The rule that introduces BASE (basically available, soft state, eventually consistent): give up immediate consistency in exchange for availability and freedom to scale, and let replicas converge over time. It is the trade-off behind most NoSQL stores (CAP itself is covered in Module 9, part 2) |
| 25 | Use caching to take load off the persistence layer |
| 29 | Always be able to roll back. Every release should be reversible, the rollback rehearsed before production, and used without hesitation when an incident calls for it — relying on "fix forward" works until the day it doesn't |
| 35 | Avoid SELECT *: it invites data-mapping bugs when the schema changes, and moves data nobody asked for |
| 46 | Don't make a vendor's proprietary feature your scaling strategy. It adds complexity, ties your future to someone else's roadmap, and tends to grow your costs faster than your traffic |
| 50 | Own the competence for every component you run, whether you built it or bought it. Customers hold you responsible for the whole service, suppliers included; buying a product does not excuse you from knowing how to deploy, operate and troubleshoot it |
Other high-level influences on scalability: whether the system leverages on-premise or cloud infrastructure (hybrid approaches and private clouds exist, and hybrid is becoming more common for medium and large systems); stateful or stateless design, where stateless components generally scale better but at the cost of storing state externally and making extra calls to get and save state data. Scalability testing is challenging and tightly related to performance testing.
Listen to your clients but always try to differentiate the real needs of the business from the wishes of very specific stakeholders. Ultimate scalability is very expensive to achieve — be mindful whether it is what is really needed.
Reliability, faults, errors, failures
Reliability is tightly coupled with fault tolerance, and under some conditions can be treated as a synonym — though not in all cases. Some sources don't define reliability as standalone and unite it with availability: "in fact, availability builds upon the concept of reliability by adding the notion of recovery — that is, when a system breaks, it repairs itself." (Bass, Clements & Kazman, Software Architecture in Practice, 3rd ed., ch. 5)
The precise chain (Hanmer, Patterns for Fault Tolerant Software):
| Term | Definition |
|---|---|
| Failure | Occurs when the delivered service no longer complies with the specification — the agreed description of the system's expected function or service. Examples: the system crashes to a stop when it shouldn't; it computes an incorrect result; it is not available for service; it is unable to respond to user interaction. Whenever the system does the wrong thing it has failed. Failures are detected by the observer and users of the system |
| Error | That part of the system state liable to lead to subsequent failure; an error affecting the service is an indication that a failure occurs or has occurred. It is incorrect system behaviour from which a failure may occur. Two types: timing or value. Value errors might be incorrect discrete values or incorrect system state; timing errors can include total non-performance (the time was infinite) |
| Fault | The adjudged or hypothesized cause of an error — the defect present in the system that can cause an error, the actual deviation from correctness. In a program it is the misplaced comma or period, or the missing break in a C++ switch. Colloquially called a "bug". It might be a latent software defect, or a garbled message received on a communications channel. In general, neither the software nor the observers are aware of the presence of a fault until an error occurs |
Common errors:
- Timing or race conditions — communicating processes get out of synchronization and a race for resources occurs
- Infinite loops — continuous execution of a tight loop without pausing and without acknowledging others' requests for shared resources
- Protocol errors — errors in the messaging stream from non-conformance with the protocol: unexpected messages, messages sent at inappropriate times, or out of sequence
- Data inconsistency — data differs between two locations, e.g. memory and disk, or between different network elements
- Failure to handle overload conditions — the system is unable to handle the workload
- Wild transfer or wild write — data written to an incorrect memory location, or a transfer to an incorrect location, if there is a fault
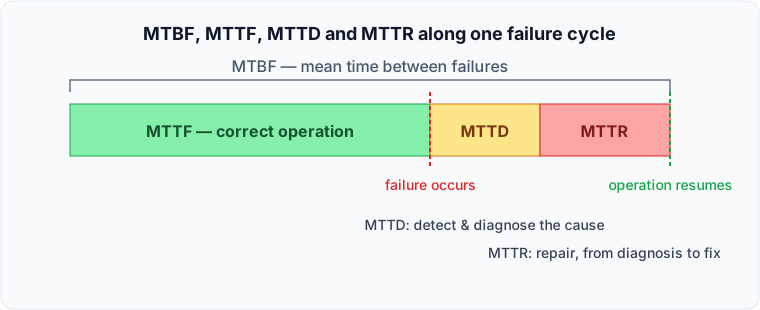
These reliability metrics compose along a single failure cycle rather than standing alone: MTBF (mean time between failures) spans the whole interval from one failure to the next, and decomposes into MTTF (the correct-behaviour time before a failure), MTTD (mean time to diagnose — the time spent detecting and localising the cause once a failure has occurred) and MTTR (mean time to repair, from diagnosis to restored correct behaviour). Part 1's availability formula, MTTF ÷ (MTTF + MTTR), uses MTTR to cover diagnose-plus-repair unless MTTD is tracked and budgeted separately, which matters when triaging where an incident's time actually went.
There is a special mindset for developing fault-tolerant systems, and key principles — some applicable to all systems, others only under certain conditions. Running experiments directly in production implies substantial maturity in monitoring, recovery and resiliency; it is not recommended unless you satisfy all the prerequisites and understand the potential impact of the worst case.
Netflix is the industry's good example of a highly reliable fault-tolerant system, running tests directly in production to evaluate and measure the impact of removing components or injecting errors into the execution flow. Some elements remove components running in production; others search for unused resources and non-compliance and apply fixes; yet others search for security vulnerabilities. These approaches proved efficient for achieving high reliability, but again are not recommended without mature operations and monitoring practices and a robust environment and architecture supporting resiliency and self-healing.
That mindset starts from a single core question — what can go wrong in any given situation? — and works outward from it: eliminate potential single points of failure, make deliberate trade-offs rather than accidental ones, keep the design simple (KISS), and follow established design and coding practices. Where a computation is critical enough to justify the cost, N-version programming — running independently developed implementations of the same function in parallel and comparing their outputs — is the tactic of last resort for masking a design fault that redundancy alone cannot catch, since identical replicas would simply repeat the same bug.
Availability mathematics
Almost any software SLA tries to provide availability claims. Scheduled downtimes may not be considered when calculating availability, because the system is deemed "not needed" then — but of course this depends on the specific requirements, often encoded in the SLA.
| Nines | Approximate downtime per year | Approximate downtime per month |
|---|---|---|
| 99% | ~3.65 days | ~7.3 hours |
| 99.9% | ~8.76 hours | ~43.8 minutes |
| 99.99% | ~52.6 minutes | ~4.4 minutes |
| 99.999% | ~5.26 minutes | ~26 seconds |
Year = 365 days; month = 730 hours, the period most cloud SLAs are measured over.
The conclusion from real IT industry examples is that achieving even 99.9% availability may be much more challenging than it seems at first glance. When someone requests more than three nines availability, be extra careful — if that is a real requirement, it will be very expensive to achieve.
Composition rules (the maths behind part 1's booking-path budget, and the same formulas the Module 9 Task uses):
Series — components that are single points of failure — multiply:
A_total = A₁ × A₂ × A₃ × … × Aₙ
Redundancy of m identical copies of a component — one minus the probability that all copies are unavailable:
A_component = 1 − (1 − A₁)^m
A component's total fair availability includes both the infrastructure it runs on (hardware + OS + provided software) and the software itself, because each can fail:
A_component = A_infrastructure × A_software
All three formulas assume the basic scenario: copies are fully identical with the same availability and work constantly (no partial operation or unequal availability), and one software component runs per one infrastructure component — virtualisation with VMs and containers makes the calculation more complex. They also assume failures are independent and failover is perfect. Correlated failures — the same bug in every copy, one bad release deployed everywhere, a shared zone or region outage — break that assumption, so the redundancy formula is optimistic, especially for identical software replicas.
Cloud specifics. Often you use existing IaaS/PaaS/SaaS services, so you do not calculate availability from scratch but rely on the numbers published by the provider — use the service SLA to estimate total availability. What adds real complexity is that each cloud can use its own definitions (for example, what "unavailability" means) and can have many exclusions, so always read what is written at the end of the agreement.
The tricky example: Amazon's SLA for EC2 uses a region-based approach and commits to 99.99% monthly uptime only if you run EC2 in 2 or more Availability Zones (a single instance is covered at 99.5%) — and this number does not increase if you use 3 or more zones. So 99.99% is the most AWS commits to for one region: a service-credit threshold measured monthly, not a ceiling on what your architecture can achieve. If you need a better figure, you must engineer and justify it yourself, typically across regions.
The formulas apply to both software and hardware components.
SLIs, SLOs, SLAs and error budgets
Site reliability engineering gives an availability target an operating vocabulary (Beyer, Jones, Petoff & Murphy, Site Reliability Engineering, 2016; the good ÷ valid events framing is from Beyer et al., The Site Reliability Workbook, 2018):
| Term | Meaning | On Lumen |
|---|---|---|
| SLI — service level indicator | A measured ratio: good events ÷ valid events | Share of valid booking-path requests answered without error or timeout, measured at the portal front end |
| SLO — service level objective | The target for an SLI over a stated window | 99.9% of valid requests succeed, 24×7 over a rolling year (QA01); latency has its own SLO: 95% of routine-screen requests within 2 s in the busiest hour (QA02) |
| SLA — service level agreement | The contractual promise, with consequences such as service credits | Set looser than the SLO, so the Supplier breaches its own objective — and reacts — before it owes Lumen anything |
| Error budget | 1 − SLO: the unreliability the team may spend | 0.1% of valid requests; read as time, about 8.76 h a year or 43.8 min in a 730-hour month |
The window matters as much as the percentage. QA01 is stated over a year because that is how the cost was derived; operated as a monthly SLO at the same percentage it becomes stricter, because a bad month cannot borrow from a good one.
The budget turns availability into a release policy: while budget remains, the team ships; once it is spent, risky changes stop until reliability work restores it. It also exposes conflicts between ASRs. If QA08's 10 minutes of reduced service per release counts against the budget, four releases in a month spend 40 of its 44 minutes.
Recovery objectives — RTO and RPO
Availability covers the everyday faults a redundant pair absorbs. Disaster recovery covers losing a whole site or region — exactly the correlated failure the redundancy formula assumes away. Two numbers specify it:
- RTO (recovery time objective) — the longest acceptable time from the disruption to restored service
- RPO (recovery point objective) — the most data you may lose, measured as time: how old the restored data may be
Like availability, both are priced rather than picked: RTO from the cost of an outage hour, RPO from the cost of re-creating lost work. Together they select a strategy. The four common ones, cheapest first, as AWS's Disaster Recovery of Workloads on AWS names them:
| Strategy | What runs in the recovery region | Typical RTO / RPO |
|---|---|---|
| Backup and restore | Backups only; everything rebuilt on demand | Hours to a day / the backup interval |
| Pilot light | Data replicated continuously; compute provisioned only when needed | Tens of minutes to hours / seconds to minutes |
| Warm standby | A scaled-down full copy, always running | Minutes / seconds to minutes |
| Active-active (multi-site) | Full capacity serving traffic in both | Near zero / near zero — at the highest cost, with write conflicts to resolve |
On Lumen, QA14's assumed RTO of 4 hours and RPO of 15 minutes select pilot light: asynchronous database replication meets the RPO, and starting the application tier from infrastructure templates fits inside 4 hours. Backup and restore would miss the RPO at typical backup intervals; warm standby buys minutes nobody has asked for. In the new jurisdiction the recovery region must also satisfy QA05 — if the provider has only one region there, DR and residency conflict, and that trade-off goes back to Lumen.
Availability tactics
The SEI catalogue (Bass, Clements & Kazman, Software Architecture in Practice, 3rd ed.) sorts availability tactics by when they act on a fault: detect it, recover from it, or prevent it.
| Group | Tactics | On Lumen |
|---|---|---|
| Detect faults | Ping/echo, monitor, heartbeat, timestamp, sanity checking, condition monitoring, voting, exception detection, self-test | Balancer health checks in front of each booking-path component; a sanity check that rejects a referral extract that is empty or out of sequence (QA11) |
| Recover — preparation and repair | Active redundancy (hot spare), passive redundancy (warm spare), spare (cold), exception handling, rollback, software upgrade, retry, ignore faulty behaviour, degradation, reconfiguration | Redundant pairs on each booking-path component (QA01); degrade to cached partner availability when the partner API is down; roll back a bad release (QA08); retry partner calls with backoff |
| Recover — reintroduction | Shadow, state resynchronisation, escalating restart, non-stop forwarding | Resynchronise a recovered region's state before it takes traffic back after a QA14 failover |
| Prevent faults | Removal from service, transactions, predictive model, exception prevention, increase competence set | Drain a node before patching it; write a booking and its notification request in one transaction, so a crash cannot confirm a booking without notifying the patient |
Detection and recovery only work together: a redundant pair with no health check never fails over, and a heartbeat with no spare only tells you the service is down.
Security in depth
Threat modelling is the technique and toolset that helps understand potential security challenges and concerns — for example investigating how secure a web service and its environment are. You usually need a security expert involved in security design and testing if there are very specific and detailed security requirements; a security competence centre can perform threat modelling and other consulting as a service.
Concretely, threat modelling runs as five steps: identify the elements (decomposing the system into its components and modules), identify the threats against each, document them, rate them, and determine the countermeasures and mitigations worth applying. The deliverable is typically a data-flow diagram annotated with trust boundaries, paired with a rated list of threats and mitigations — that pairing, not the STRIDE letters alone, is what a completed threat model looks like.
STRIDE is a threat classification model developed by Microsoft for reasoning about security threats. It was initially created as part of the threat modelling process and is used in conjunction with a model of the target system constructed in parallel, including a full breakdown of processes, data stores, data flows and trust boundaries.
| Letter | Threat |
|---|---|
| S | Spoofing |
| T | Tampering |
| R | Repudiation |
| I | Information disclosure |
| D | Denial of service |
| E | Elevation of privilege |
SEI organises its own security tactics catalogue around four response categories that parallel how Performance and Availability tactics are grouped: Detect Attacks (detect intrusion, detect service denial, verify message integrity, detect message delay), Resist Attacks (identify/authenticate/authorize actors, limit access and exposure, encrypt data, separate entities, change default settings), React to Attacks (revoke access, lock computer, inform actors) and Recover from Attacks (maintain audit trail; restore, via the availability tactics). Framing security tactics as a detect/resist/react/recover cycle is what lets an architect check coverage the same way they would for a fault-tolerance or performance design.
OWASP — an industry initiative gathering knowledge about the most common security threats and methods for preventing them. The OWASP Top Ten is a powerful awareness document representing a broad consensus about the most critical web application security flaws, produced by security experts worldwide and revised every three to four years (2003, 2004, 2007, 2010, 2013, 2017, 2021, 2025); the current edition is the OWASP Top 10:2025, so always state which edition you test against. The free web application security scanner long known as OWASP ZAP (now just ZAP — it has not been an OWASP project since 2023) can be built into a CI/CD pipeline to enable continuous security verification (DevSecOps).
Always understand your security testing methodology and strategy — other types such as penetration testing can be leveraged. Everything is driven by the requirements and the type of solution you are building.
For the full treatment of health data — the privacy architecture and the regulatory questions Lumen raises — see Module 10, Security and Privacy Architecture.
Observability in depth
Observability is how well you can work out what a system is doing, and why, from the data it emits — including for failures nobody predicted. The word comes from control theory: Rudolf Kálmán (1960) called a system observable when its internal state can be reconstructed from its outputs. Majors, Fong-Jones & Miranda (Observability Engineering, O'Reilly, 2022) draw the working line against monitoring. Monitoring watches for the failure modes you anticipated, with dashboards and thresholds. Observability lets you ask a new question of the running system without shipping code to answer it. A distributed system fails in ways nobody listed, so it needs both.
It is an architectural concern rather than a tooling purchase because context must cross every boundary. A trace that stops at a queue, or a log line with no request identifier, cannot be repaired later by a better dashboard: every component and every asynchronous hop has to carry the context from the start. That is the wide impact indicator from part 1, and the reason Lumen's QA17 rates H for architectural impact.
Signals: logs, metrics, traces, events, profiles
| Signal | What it is | Best at | What drives its cost |
|---|---|---|---|
| Metrics | Numbers aggregated over time — counters, gauges, histograms — each tagged with a few labels | Detection and trends: is the error rate rising? Cheap to keep for months | Cardinality: every distinct combination of label values is a separate time series |
| Logs | Timestamped records of discrete happenings, ideally structured | The detail of one occurrence: the error message, the rejected input | Volume ingested, and retention |
| Traces | The path of one request through every component, as a tree of timed spans that share a trace ID | Localisation: which hop spent the latency or raised the error | Spans per request × the sampling rate |
| Events | Named, structured records of a business or system occurrence — "booking confirmed", "release deployed". OpenTelemetry carries them as log records with an event name | Correlating behaviour with change, and following a business process | Volume |
| Profiles | Continuous samples of where code spends CPU and memory in production | The cause inside one component once a trace has found it — the profiler story above, run in production | Sampling frequency |
Metrics tell you that something is wrong, traces where, logs and profiles why. The signals are worth most when linked: an exemplar attaches a trace ID to a metric data point, so a latency spike on a dashboard leads straight to one slow request.
OpenTelemetry
OpenTelemetry (OTel) is the vendor-neutral standard for producing and moving telemetry — a Cloud Native Computing Foundation project formed in 2019 by merging OpenTracing and OpenCensus. It defines:
- APIs and SDKs for instrumenting code, plus auto-instrumentation for common frameworks
- Semantic conventions, so that an HTTP route or a database call is named the same way by every service
- OTLP, the protocol that carries telemetry
- The Collector, a pipeline that receives telemetry, processes it — batching, sampling, redaction — and exports it to any backend
Traces, metrics and logs are stable. Profiles entered public alpha in 2026; check their status before depending on them. Context crosses process boundaries in the W3C Trace Context format (a W3C Recommendation since 2020): the traceparent header carries the trace ID and the parent span ID on every call.
The architectural value is decoupling instrumentation from the backend. Services instrument once against the OTel API, and the choice of backend — open source or a vendor — becomes Collector configuration that can be reversed without touching a service. Fix the instrumentation standard early; the backend can follow.
What to measure: golden signals, RED and USE
The four golden signals (Beyer et al., Site Reliability Engineering, 2016, ch. 6) are the four to measure if a user-facing system allows only four:
| Signal | Meaning | On Lumen's booking path |
|---|---|---|
| Latency | Time to serve a request. Track failed requests separately: a fast error flatters the average | p95 per screen class — QA02's SLI |
| Traffic | Demand on the system | Requests a second; referrals and searches an hour, against the busiest-hour 1,680 and 6,720 |
| Errors | The rate of failed requests — explicit (a 5xx), implicit (a success code with the wrong content) and by policy (slower than the SLO counts as failed) | QA01's SLI |
| Saturation | How full the most constrained resource is, and how close to its limit | Database connections and CPU, notification-queue depth, function concurrency against the account limit |
Two methods apply the same thinking at different layers:
| Method | Signals | Apply to | Source |
|---|---|---|---|
| RED | Rate, Errors, Duration | Every request-driven service: each API route, each function | Tom Wilkie, at Weaveworks |
| USE | Utilisation, Saturation, Errors | Every resource: CPU, memory, disk, network, connection pools, queues | Brendan Gregg (2012; Systems Performance, 2nd ed., 2020) |
RED shows how a service's callers experience it; USE shows which resource is to blame. Start an investigation with RED on the service that is breaching its SLO, then apply USE to the resources beneath it.
Structured logs and correlation IDs
A structured log is a record with named fields — JSON or key-value pairs — rather than a sentence, for example {"level": "warn", "service": "booking", "event": "offer.expired", "trace_id": "4bf9…", "region": "r2"}. Machines can filter and aggregate it, and its fields can be reviewed like any other interface. Four rules: one record per event; field names from the OTel semantic conventions; severity levels used consistently; and the trace and span IDs on every record, so a log line leads to its trace.
A correlation ID follows a business transaction across boundaries that one trace cannot span. A Lumen referral lives for days: the extract that carries it, the sync, triage, the offer, several stage changes and a dozen messages, each its own request with its own trace. Assign an opaque correlation token when the referral first arrives, carry it in every span attribute, log record and message about that referral, and one query returns the whole history. That is QA17's "any referral traced end to end" — the question Module 4's event-driven trade-offs warn an event chain cannot answer without it.
Sampling keeps tracing affordable. Head sampling decides at the start of a request — keep 10%, say: cheap, but blind to how the request ends. Tail sampling decides once the trace is complete, in the Collector, so it can keep every error and every slow request and sample the rest. QA17's "any referral" therefore rests on the correlation token in logs and events, which are kept for every referral, not on keeping every trace.
Alerting on SLO burn rate
SLIs, SLOs, SLAs and error budgets above turns QA01 into a 0.1% error budget. The Site Reliability Workbook (Beyer et al., 2018, ch. 5) recommends alerting on that budget: page on the symptoms users feel, and use the signals above to find the cause. An alert on CPU fires when nobody is affected and stays silent when a dependency fails.
The burn rate is how fast the budget is being spent, relative to spending it exactly over the SLO window:
burn rate = observed error ratio ÷ (1 − SLO)
At 99.9%, a burn rate of 1 means 0.1% of requests are failing and the budget lasts exactly the window. A burn rate of 14.4 means 1.44% are failing; over a 30-day window that spends 2% of the budget in one hour (14.4 × 1 h ÷ 720 h).
A good alert pages quickly for a severe burn and stays quiet for a blip. The Workbook's starting point is multiwindow, multi-burn-rate alerting, with thresholds set for a 30-day budget:
| Severity | Burn rate | Long window | Short window | Budget spent when it fires |
|---|---|---|---|---|
| Page | 14.4 | 1 hour | 5 minutes | 2% |
| Page | 6 | 6 hours | 30 minutes | 5% |
| Ticket | 1 | 3 days | 6 hours | 10% |
An alert fires only when both windows exceed the rate: the long window makes it significant, and the short window lets it clear soon after recovery. Alert on a 30-day budget even though QA01 is reported over a year — the stricter operating view described in the SLO section.
How quickly does it fire? For a failure that starts suddenly and holds at error ratio e:
detection time = burn rate × (1 − SLO) × long window ÷ e
For Lumen's booking path at 99.9% under the 1-hour rule, that is 14.4 × 0.001 × 60 min ÷ e = 0.864 min ÷ e:
| Share of requests failing | Time to page |
|---|---|
| 100% — a full outage | ≈ 52 seconds |
| 25% | ≈ 3.5 minutes |
| 2% | ≈ 43 minutes |
The 25% row is where QA17's 5-minute measure comes from, with time to spare for rule evaluation and delivery. The 2% row is deliberate. A rule like this always fires having spent the same 2% of the month's budget, the 6-hour rule catches slower burns still, and paging people for minor burns teaches them to ignore pages.
Two adjustments for Lumen:
- Low traffic. At 03:00 the booking path may see a few requests a minute, and one failure is a large ratio. Run a synthetic transaction — a scripted search and booking against a test centre — every minute, so the SLI never runs dry, and require a minimum request count before a ratio alert can fire
- A large budget. QA02 allows 5% of requests over 2 s, so a burn rate of 14.4 would need 72% of requests to be slow before it paged. For a latency SLO with a budget that large, page on a short window at a lower rate — for example, a fifth of one screen class's requests over 2 s across 5 minutes, a burn rate of 4, which a quarter-slow failure crosses after 4 minutes — and accept more false alarms
PHI-safe telemetry
Telemetry is data, and on Lumen it comes from a system full of health information. Hold it to the rules of the data it describes:
- Keep identifiers out. No names, contact details, dates of birth, clinical details or referral numbers in log messages, span attributes or metric labels. Use the opaque correlation token; resolving a token to a referral happens inside the application, behind QA13's access control and audit
- Allowlist, don't blocklist. The Collector drops every attribute that is not on an approved list, so a developer's new debug field cannot leak by default. Redaction rules catch what slips into free text
- Never a person-level metric label. A patient or referral ID as a label is a leak and a cardinality explosion at once: about 350,000 new time series a month
- Residency applies. QA05 covers backups and audit records; it covers telemetry too. Run the Collector and the backend in the region of collection. An observability service that stores data in another jurisdiction breaks QA05 even when the application never does
- Separate the audit trail. QA13's access records are evidence, with their own retention, integrity protection and access rules; operational logs are diagnostic, sampled and short-lived. Do not let one pipeline serve both
Whether telemetry counts as regulated health data, and what an observability vendor must sign — a business associate agreement under HIPAA or a processor agreement under GDPR, for example — depends on the jurisdictions Lumen actually operates in. Ask, design for the strict reading, and keep the evidence. Module 10 treats health data in full.
Observability scenario template
| Part | Options |
|---|---|
| Source | Internal fault or regression; a failing dependency; an operator, support agent or auditor with a question |
| Stimulus | An SLO starts to burn; an unfamiliar failure; a question about one transaction ("why was this patient not notified?"); scheduled work that silently does not happen |
| Artifact | Services, queues, data stores, external dependencies — and the telemetry pipeline itself |
| Environment | Normal, low traffic, during a release, degraded, after a regional failover |
| Response | Detect and page on symptoms; localise to a component; reconstruct one transaction end to end; answer a new question without deploying code |
| Measure | Time to detect and localise — the MTTD of the reliability section; share of transactions traceable end to end; share of pages that needed action; share of components emitting the golden signals; telemetry cost as a share of run cost; personal data found in telemetry (target: none) |
Observability tactics
SEI's catalogues touch observation in two places: testability's control and observe system state, in part 1, and availability's detect faults group above. Operating a distributed service needs a catalogue of its own:
| Group | Tactics | On Lumen |
|---|---|---|
| Instrument | OTel SDKs and auto-instrumentation; RED metrics per route; structured logs; business events as telemetry | Every function emits RED metrics per route and per screen class, because QA02's SLI is per screen class; every stage change emits an event |
| Propagate context | W3C Trace Context on every synchronous call; trace context and correlation token in message attributes across queues and batch steps | The referral sync assigns the token at ingestion; it rides through booking, the stage-change handler and the notification queue to each email and SMS dispatch |
| Collect and route | A Collector tier for batching, redaction, sampling and export; tail sampling | One Collector per regional stack, exporting in-region. Keep every errored trace and every trace over 2 s; sample 10% of the rest (assumed) |
| Detect | SLO burn-rate alerts; synthetic transactions; heartbeats on scheduled work; saturation alerts | Burn-rate pages on QA01 and QA02; a synthetic booking every minute; an alert if no referral extract has been processed for 20 minutes — the absence of a signal is a signal |
| Diagnose | Exemplars from metrics to traces; per-component dashboards on the golden signals; a runbook linked from every alert | The page names the booking-path component overspending its share of the latency budget from part 1's Step 3 |
| Protect | Attribute allowlists; redaction; in-region storage; role-based access; a separate audit pipeline | Telemetry stays in the region of collection (QA05); audit records (QA13) travel their own pipeline |
| Contain cost | Sampling; retention tiers; cardinality limits; no debug logging in production by default | Metrics kept 13 months, logs 30 days, traces 14 days (assumed) — long enough for QA17's 30-day lookup, which runs on logs and events |
Watch the watcher: if the telemetry pipeline fails, every alert goes silent at once, and silence looks like health. Check the pipeline's own heartbeat from outside it.
Cost-efficiency in depth
Cost as a quality attribute
On premises, cost was settled at purchase and the capacity was sunk. In the cloud every architectural decision has a running price, billed monthly and changed by the next release. Cost then behaves like any other quality attribute: it has a stimulus (growth, a change), a response (spend that scales well or badly) and a measure. Werner Vogels' The Frugal Architect (2023) makes treating cost as a non-functional requirement its first law, and its second asks that a system's cost follow the business dimension that pays for it. The case says the same in one line: the Supplier "should meet the requirements cost-efficiently".
Unit economics: cost per referral
Total spend is the wrong measure, because it rises with success. The measure is unit cost: run cost divided by the business unit that carries the value.
unit cost = run cost ÷ business units
For Lumen the unit is the referral. Module 9's cost model totals ≈ $19,360 a month, against 14,000 referrals × ~25 operating days ≈ 350,000 a month, so the baseline is ≈ $0.055 per referral. By line:
| Line | Monthly | Per referral | Share |
|---|---|---|---|
| SMS — 2.1M messages | $12,600 | $0.036 | 65% |
| Platform — four regional stacks | $4,851 | $0.014 | 25% |
| Non-production | $1,550 | $0.004 | 8% |
| All other volume-driven lines — gateway, functions, email, egress, logs, reporting | $358 | $0.001 | 2% |
| Total | ≈ $19,360 | ≈ $0.055 |
Four readings, each an architectural point:
- Compute is a tenth of a cent. Gateway, functions, email, egress, logs and reporting together cost about $0.001 per referral. Right-sizing functions — the tactic everyone reaches for first — cannot move QA18. The SMS policy and the number of regional stacks can
- Fixed lines fall per unit as volume grows. Scale the volume-driven lines by 1.405 and hold the platform flat, as Module 9 does: ≈ $24,646 a month ÷ ≈ 491,750 referrals ≈ $0.050 at year-3 volume. A unit cost that rises under growth signals waste, not success
- Topology pushes it back up. Add the two planned regions as two more stacks and the year-3 figure becomes ≈ $27,800 ÷ 491,750 ≈ $0.057. Disaster-recovery copies for QA14, outside Module 9's model, come on top. QA18's $0.06 ceiling is therefore where cost meets residency (QA05) and recovery (QA14): a trade-off point to price before the target is agreed
- Run cost is small next to the business case. $0.055 is under 3% of Lumen's ≈ $2 target for an automated booking. The bid is another matter: five-year total cost is 25% of the evaluation
Two measurement details decide whether the number is usable. Compute it daily, but alert on a rolling 7 days: platform lines bill every day while referrals arrive only on operating days, so a daily ratio jumps every Sunday. And bills arrive late, by hours, so also watch the metrics that drive the bill — SMS sent per referral, invocations per request — which observability already collects. Vogels' fourth law makes the link: "unobserved systems lead to unknown costs".
Cost-efficiency scenario template
| Part | Options |
|---|---|
| Source | Business growth; a design, configuration or price change; a runaway process or forgotten resource; an attacker generating billable load ("denial of wallet") |
| Stimulus | Volume grows; a feature, region or environment is added; usage spikes; a provider changes a price |
| Artifact | The deployed estate — production and non-production — and its bill, allocated to components and regions |
| Environment | Normal operation, growth, an incident, the build phase before go-live |
| Response | Unit cost computed and attributed to components; anomalies alerted to a named cost owner; guardrails cap runaway spend; the cost model updated before a change ships |
| Measure | Cost per business unit against target; share of spend allocated by tag; time from anomaly to alert; forecast error; idle spend — resources running with no traffic |
Cost tactics
| Tactic | What it does | What it costs you | On Lumen |
|---|---|---|---|
| Right-sizing | Match instance, node and function sizes to measured use, and revisit after launch | Headroom: a right-sized node has less room for a spike | Module 9 sized each regional database at 2 vCPU from its working set — about a quarter of ≈ 45 GB — not from habit |
| Elasticity and scale-to-zero | Pay only while capacity is used: autoscaling, serverless functions, environments switched off when idle | Cold starts and scale-up delay, which spend QA02's latency budget; some managed services cannot stop | Functions cost nothing at 03:00; switching development and test off outside working hours removes a large part of the non-production line |
| Storage tiering and lifecycle | Move data to cheaper tiers as it cools; delete what no rule requires you to keep | Retrieval time and fees from cold tiers | The case already archives records after 18 months. Tier operational logs freely, but not the audit trail: an archive tier that takes hours to restore cannot meet QA13's one-hour access history |
| Commitment discounts | Reserved capacity, savings plans or committed-use discounts for the steady baseline | Lock-in for one to three years, against a plan that may change | Once Lumen has answered the residency question, commit the database nodes that run all 730 hours of the month in the regions that keep their own stack: reservations are per region, and a later consolidation would strand them. Leave the search nodes on demand until the search-cluster sizing is settled, and the two new regions uncommitted until they exist (Module 9) |
| Fewer hops, less chattiness | Remove intermediaries; use coarse-grained calls; batch database round trips | Some modularity and reuse | A separate data-access service would add an invocation to most of the 33.3M a month and a component in series on every path — Module 9's last lesson |
| Async and batch | Move work off the request path into queues and batches; run interruptible batch on spot or preemptible capacity | Delay on the deferred work; spot capacity can be reclaimed mid-run | Rebuild reporting projections in batch; partition the reporting store by month, so a query scans the months it needs rather than all 18 |
| Caching | Serve repeated reads from memory or a CDN instead of recomputing or refetching | Staleness, and the cache's own cost | Cached partner availability spares the partner API and the search cluster; front-end assets come from a CDN |
| Data-transfer awareness | Know which bytes are billed — internet egress, cross-zone, cross-region, NAT — and keep chatty pairs together | Placement constraints | Egress is ≈ $93 a month today. QA14's cross-region replication, and any telemetry shipped to an out-of-region service, are the transfers to price |
Cost trade-offs
Cost is rarely traded on its own. The pairings that bite on Lumen:
| Trade-off | Where it bites |
|---|---|
| Cost vs availability | Redundancy is paid for every month: the search cluster has three nodes for quorum, not for load, and a recovery copy per region (QA14) is pure insurance. Price it against the outage hours it removes, at ≈ $11,760 an hour at peak |
| Cost vs performance | Headroom, pre-warmed function capacity to avoid cold starts, and caches all cost money to protect QA02's p95. Buy them where the latency budget is tight — search, with 0.9 s of the 2 s — not everywhere |
| Cost vs residency | Reading "comply in each region" as "deploy in each region" costs ≈ $3,040 a month in Module 9's model. Residency is the legal precondition (QA05); whether every region needs its own stack is a clarification question for Lumen |
| Cost vs observability | Telemetry is a cost line that grows with traffic and with curiosity. Sampling and retention are the controls; dropping the correlation token to save bytes would break QA17 |
Running cost as a continuous practice — allocation, budgets, commitments and the FinOps Foundation's inform, optimise and operate phases — belongs to Module 9.
Other quality attributes
You will find information on many other quality attributes, and that should not be a surprise: there is no single one-size-fits-all list. Refer to the product quality model in ISO/IEC 25010:2023 (clause 4.2 of the 2011 edition) for a substantial list.
Remember: knowing quality attribute lists, tactics and patterns is a very good starting point for having proper conversations with clients. For creating good architectures you have to analyse the broader picture — other ASRs, business needs, industry reference architectures and similar.
Quality attributes under a service-oriented architecture
Quality Attributes and Service-Oriented Architectures (SEI, CMU/SEI-2005-TN-014) exists because software architecture is the bridge between mission/business goals and a software-intensive system, and quality attribute requirements drive architecture design — so it matters how a chosen style supports them.
The report's status column rates the maturity of SOA in each area: green = known solutions on relatively mature standards and technology; yellow = some solutions exist but need further research to prove usefulness; red = standards and technology immature, significant further effort required. The ratings date from 2005 and some have aged — SAML, for one, is now mature — so read the table as a checklist of questions to ask of any service-based design, not as a current verdict.
| Quality attribute | SOA's effect | Status |
|---|---|---|
| Interoperability | Underlying standards give good interoperability technology-wise, letting services built in different languages on different platforms interact. However semantic interoperability is not fully addressed — those standards are immature and still being developed | Green |
| Extensibility | Extending an SOA by adding new services or incorporating additional capabilities into existing ones is well supported — but the interface/formal contract must be designed carefully so it can be extended without breaking consumers | Green |
| Reliability | Problems can occur in many areas, but WS-Reliability and WS-ReliableMessaging should mean messages are transmitted reliably. Service reliability is still an issue | Yellow |
| Availability | It is up to the service users to negotiate an SLA setting an agreed level of availability with penalties for noncompliance. Availability improves if a provider builds in contingencies such as exception handling that dynamically locates another source for the needed service | Yellow |
| Usability | May decrease if the services support human interaction and there are performance problems with those services | Yellow |
| Scalability | There are ways to handle more service users and more requests, but these solutions require detailed analysis by the providers to ensure other quality attributes aren't negatively impacted | Yellow |
| Adaptability | SOA should have a positive impact, as long as the adaptations are anticipated. But it is left up to users and providers and no standards support it; must be managed in coordination with stability and performance | Yellow |
| Operability and Deployability | Operating and deploying services and systems that use them requires deliberate support | Yellow |
| Security | The need for encryption, authentication and trust requires detailed attention within the architecture. Many standards are being developed (SAML, XACML) but most are still immature | Red |
| Performance | SOA can have a negative impact due to network delays, the overhead of looking up services in a directory, and XML parsing in web services. The architecture must be evaluated carefully and providers must design and evaluate their services carefully | Red |
| Testability | Negatively impacted by the complexity of testing services distributed across a network. Those services might be provided by external organisations with no source code access, and if they implement runtime discovery it may be impossible to identify which services are used until the system executes | Red |
| Auditability | Negatively impacted if end-to-end auditing capabilities aren't built in by the service users | Red |
The report's own caveat, which is the real lesson: as with any architecture, trade-offs between quality attribute requirements must be made, and the resulting decisions may impact the organisation's ability to meet its business goals. In each system the quality attributes must be characterised specifically — using scenarios — and then weighed against this information.
Check yourself
- Lumen's configurable rules-and-workflow mechanism costs $120,000 to build. When is it gold-plating?
- Two instances at 99.5% each compose to 99.998% on paper. Why should you distrust that figure?
- QA01 is 99.9% over a year. What changes if you run it as a 99.9% monthly SLO?
- Why is backup and restore a poor fit for QA14's RPO and RTO?
- A heartbeat and a redundant pair: which tactic group does each belong to, and why is one useless without the other?
- Which scale-cube axis lets a monolith scale, and which one makes a system distributed?
- The team wants to know whether Lumen survives Monday mornings after three years of growth. Which performance tests answer that?
- Which STRIDE threats does QA12 (partner data isolation) address, and which security tactic groups does its scenario use?
- A full outage of Lumen's booking path pages in under a minute, but a 2% failure rate takes about 43 minutes. Is that a flaw in the alerting?
- The two new regions push Lumen's unit cost toward QA18's $0.06 ceiling, and a developer proposes halving function memory from 512 MB to 256 MB to make room. What do you tell them?
Suggested answers
- When N × cost(change in code) ≤ cost(mechanism) + N × cost(change by configuration) over the period you care about — with the illustrative figures, fewer than about 33 changes. Then hand-made changes are cheaper, and QA10 should be argued down rather than built.
- The redundancy formula assumes independent failures and perfect failover. Identical software, a shared release, a shared zone, or a balancer sitting in series all break that, so the real figure is lower — which is why disaster recovery is specified separately.
- It becomes stricter: each month gets about 43.8 minutes, and a bad month cannot borrow from a good one. The error budget also becomes a release policy — once it is spent, risky changes stop.
- It loses everything since the last backup copied to the recovery region, typically hours. Log shipping every few minutes could meet 15 minutes, but rebuilding the stack and 6.5 million records inside 4 hours is fragile; continuous replication (pilot light) meets both with margin.
- The heartbeat detects faults; the redundant pair belongs to recovery (preparation and repair). A pair with no detection never fails over, and detection with no spare only reports the outage.
- X — cloning behind a load balancer — works for a monolith. Y, functional decomposition into separately deployed services, is what makes a system distributed. Z partitions data, as Lumen does by region.
- A load test at the year-3 busiest-hour mix (≈ 2,650 sessions, ≈ 2,360 referrals and ≈ 9,440 searches an hour), a spike test for the 07:00 Monday ramp, and a soak test across a full operating day to expose leaks. A stress test shows the headroom beyond that.
- Information disclosure and tampering, plus elevation of privilege if one partner could act with another's rights. Its scenario uses Resist (authorise actors, limit access), Detect (repeated refusals), React (inform actors — here, the security team) and Recover (audit trail).
- No, that is the design. Under the 1-hour rule at a burn rate of 14.4, detection time is 0.864 minutes ÷ the error ratio, and the alert always fires having spent the same 2% of the month's budget. A 2% failure rate is a real burn but not an emergency, and the 6-hour and ticket rules catch slower ones. If Lumen needs small failure rates caught faster, that means a stricter SLO or a shorter window, chosen knowingly and paid for in false pages.
- Measure first. Functions cost about $62 a month — roughly $0.0002 per referral — and halving memory can lengthen duration, so the saving may be less than half of that. SMS is $0.036 of the $0.055, so the levers are which stages send SMS, a requirement change Lumen must agree to, and the number of regional stacks. Right-sizing is still good hygiene; it is not how QA18 is met.